RPX5 includes a Daily Totals feature in the application (in versions 5.3.0 and above). This feature will provide a seven-day graphical display of total transactions and revenue, ending with the last full business day (feature does not provide a daily total for the workday in progress).
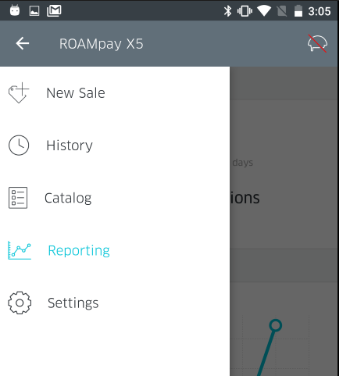
To begin, open the navigation pane, and click on the newly added option, Reporting.

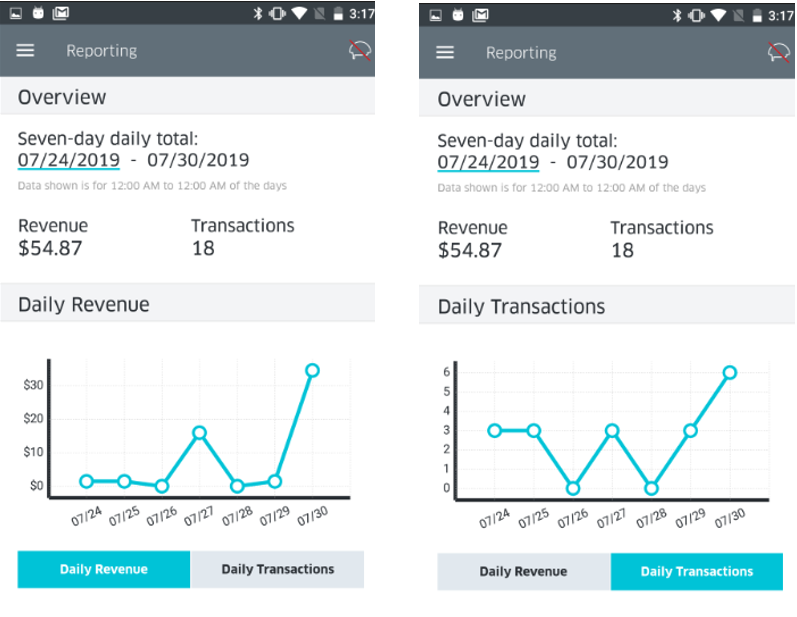
Once you click on Reporting, you will be brought to the Daily Totals screen. It will appear as shown below. You will notice there are two available options to toggle between, labeled Daily Revenue & Daily Transactions.
- Daily Revenue: This screen will show the revenue in USD graphed on the screen by date.
Daily Transactions: This screen will show the number of transactions processed by date.

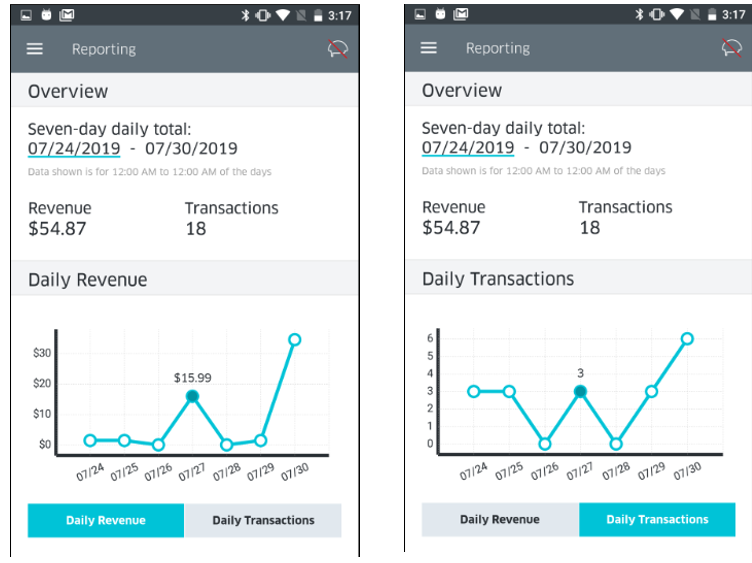
Additionally, you can click on specific data point to show the exact number of revenue earned or transactions processed (as shown below).

Clicking on the 10/24 data point shows $103, 566.71 earned on this date, across 13 processed transactions.
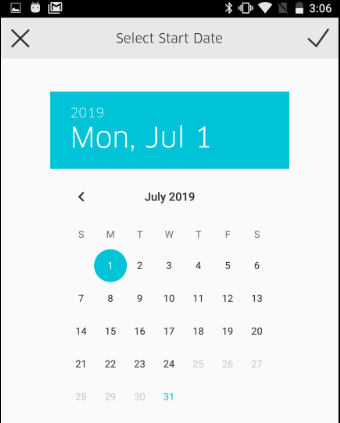
Finally, the Daily Totals feature allows users to configure a seven-day time period for a graphical display of total transactions and revenue. The maximum allowable period is anytime within six months of the previous business day. This can be accessed by clicking on the Start Date, which opens a calendar for date selection, as shown below.
